Better Web Testing With Selenium
A introduction to the benefits of using Selenium for web testing and some of the basic concepts when using the tool.
 Ten years after its introduction, Selenium is arguably the most popular open source testing tool, and for good reason.
Not only is it free and open, Selenium is also fully feature and browser-neutral. Change a single variable in the code, and the same Selenium code that drives Internet Explorer can drive Chrome or FireFox. Switch to a Mac and change the value, and it will run Safari. The Selenium community mostly lives online and mostly without a login required, so a Google search can find answers quickly — but they do also have a conference twice a year on two continents. If you are having Selenium problems, chances are someone else out there has as well, wrote questions, and probably got answers, from the internet.
Getting started with Selenium is easy, and so is getting tips to click a hard-to-click object. Creating long-term, sustained success with the tool, patterns for how to do the work and manage test results … that is a little more challenge.
SmartBear Sofware recently published a new eBook, focused on Web Testing and Selenium in 2016. You can download the eBook for free today.
If you’re new to Selenium, this post will give you some actionable advice for getting the most from your Selenium tests.
Get Stable
User Interface test suites tend to start out with compromises to get running, then fall behind while they grow in code.
Put differently: they start ugly and get uglier. If we ignore that ugliness as “under the hood” and focus on the daily results and new tests, we tend to see something like a mood disorder. One day you get an email claiming all the tests in the nightly run passed and everything is OK. The next day, two-thirds of the nightly tests have failed and it looks like the product you are testing has completely fallen apart. Look under the hood and we see the suite made an assumption about the codebase… somewhere… and that assumption has been invalidated… somewhere.
These mixed results destroy confidence in browser automation as a testing approach and also in the people doing the work.
There are two main points to consider when making your UI checks useful — good test design and stability.
Let’s Talk About Getting Some Consistent Results From Your Test Suite
I see tests fail a lot in my daily work. Lately, those failures point to a regression in the software I’m testing; something that was working before that had a problem introduced from a code change the day before. It requires a lot of tweaks to the reusable components, and to the tests themselves, to get stable. Most of those changes were to banish failures related to timing, and to finding objects on the page.
Timing
Timing is something we don’t normally notice unless things are really bad. If I am on Amazon.com trying to buy a few books and things are slow, I might grumble about it, or maybe just chalk it up to my internet connection being slow that day. But, in the end I still buy a few books. Your WebDriver scripts won’t ignore the problem by sighing and waiting things out, they just fail if the page isn’t ready at the right moment.
A typical WebDriver test is very procedural:
- Navigate to Amazon
- Type string The Shape of Actions into search field
- Click search
- Click book link
- Click Add to cart
The tests run into a hiccup because of everything that happens between each of those actions — data is sent back and forth between your computer and the server, images load, elements on the page render and become visible. If my WebDriver selects the book, and then immediately tries to click the Add to Cart button, it’s going to fail. The script doesn’t magically know that a button is ready to be clicked, or that a field can be typed in now. So, we have to wait.
WebDriver has a few different ways to temporarily pause a script in the middle of a run. The easiest, and worst way, is an explicit wait. This is when you tell the script to hang out for some amount of time, maybe 15 seconds. Explicit waits hide real problems. A lot of the time, we see the wait fail and bump the time up a few more seconds in hopes that it will work next time. Eventually we have padded enough time in the script so that the page loads completely before trying to perform the next step. But, how long is too long? These explicit waits can conceal performance problems if we aren’t careful.
The smarter way to handle waits is to base them on the specific element you want to use next. WebDriver calls these explicit waits. I have had the most luck in improving stability of a check by stacking explicit waits. After some sort of navigation, like searching for a book or clicking on a specific book link, I will generally wait for the add to cart link to exist in the page DOM and then wait for that element to be visible. It might seem like a hack or just plain overkill, but when I do this checks fail because of a software problem, not because the page was not ready.
Objects
Objects are the other tricky part of stability. At this point most everyone knows that there is a pretty clear progression towards consistency in the methods of finding an object. Clicking or typing based on pixel location is just terrible, if this is all you can do they you probably should just stop now and find some other approach to test your software. After that, we have XPath where you point tell your WebDriver exactly where to click in the page DOM based on it’s path. This is a little bit better, your test won’t fail because of a browser resize now which is nice, but moving a button into a new frame will cause problems. The clear winner is searching by an unchanging element ID. An ID search that looks something like driver.findElement(By.id(“myButton”)).click() will search high and low across a webpage for that element and click consistently no matter where it is today or tomorrow.
This sounds like a simple solution, but we aren’t all working on a pristine new software application where the developers consulted others about testability hooks before building a page. Some pages have objects that are built dynamically and just can’t be given an ID ahead of time, others have a mix of elements with and without IDs, and others just have no IDs at all. Getting IDs on your page elements is often just as much of a social challenge in convincing the development management and the developers that the work is worth the time, as it is technical.
Once you have tests that consistently report real problems, you’ll want to develop a strategy to run them.
Usage Strategy
WebDriver checks need a little room to breath, unlike tests running against an API or unit tests. Unless you’re running headless, which I’ll go into here in a minute, as soon as you click the run button a new browser instance is going to open up and the script will take control of your keyboard and mouse. That can be OK for running individual scripts, maybe you want to see exactly where a failure is happening or look for other things that the script isn’t asserting on, but a strategy is important when there are more.
The simplest approach is a nightly run of the entire suite of checks against the latest available build. The project I am working on now uses a CI system that builds on demand throughout the day, and then at the end of the day at 8pm there is an official build that also includes some data setup. We have one test suite that takes about two hours to run that is configured to run against 3 different environments. Starting at 10pm, a test run is kicked off every three hours. By the time I get up and start working at 7am, there is an email with results from each of the three test runs with results to give me a place to start researching. Depending on how well built out your set of checks is, this strategy can give you a pretty good regression testing strategy almost daily.
Alternately, maybe you don’t need to run the entire suite of checks each night. Think of regression testing as a dial to crank up and down depending on your needs. Sometimes it might make sense to run the whole thing. Other times, maybe all you need is the set of tests that covers checkout to get some quick information about how a recent change affected checkout.
Larger test sets take longer of course and running through a browser can only go so fast. Parallelization, running across multiple machines at the same time, will speed things up a little bit. Going headless will cut that time in half at least. That extra speed comes with a trade off, every approach does. Headless test runs don’t open up a browser. The test runner runs webkit quietly in the background while WebDriver simulates clicks, and button presses exactly as the script you wrote instructs. The risk here is that you miss out on some of the goodness that comes from using a real browser.
A headless test might simulate a click on a date picker and select a value with no problems, while a script that performs a click on the browser might find that clicking the date picker throws a javascript error. That extra speed comes at the loss of power and bug finding ability.
A Word of Warning
Selenium can be seductive in that it leads to a lot of power quickly (at first.) The problem comes two, six, or nine months in, when the test results as unstable and the basic architecture is ugly.
Too many people try to develop test strategies with UI automation and WebDriver but fail to see long-term results. As a test consultant, it is a sort of condemnation of our role, because by the time the project has failed, the three to six-month test contractor is long gone.
In other words, working with Selenium can be a bit like the dark side of Force. Focusing on consistent and stable test results, with a strategy around running the tests that includes full setup and teardown, can make your project more like the light side of the force than the dark.
The DevOps Zone is brought to you in partnership with New Relic. Read about where DevOps startedand how the adoption rate went from tiny startups to giant Fortune 500 enterprises.
Topics:
TESTING,SELENIUM
Platinum Partner
State of Testing 2016 Report
A look at the results from the recent "State of Testing" report from PractiTest.
The DevOps Zone is brought to you in partnership with HPE. Learn about the seven KPI’s that create the foundation of DevOps metrics and how it continues to evolve as the DevOps Methodology becomes more engrained in enterprises.
“What do you want to do when you grow up?”
I don’t think that many of us would have answered this question by saying, “I want to be a Tester when I grow up!”
Still, as it we can see (from the recent State of Testing Report) many of us today feel proud to tell our friends and family that we work as Testers and are recognized for our contribution to technology and innovation.
What is “The State of Testing”?
The State of Testing is the largest testing survey worldwide (conducted by this QA Intelligence blog together with Tea Time with testers). Now third time running, with over 1,000 participants from more than 60 countries, and in collaboration with over 20 bloggers, the survey aims to provide the most accurate overview of the testing profession and the global testing community. Held yearly, the survey also captures current and future trends.
DOWNLOAD THE 2016 STATE OF TESTING REPORT >>
Trends Worth Noting:
- Testing and development have become distributed tasks. With 70% of companies working with distributed teams in two, three or more locations. This requires adapting workflow habits and skills to maintain high productivity without close proximity to other teams involved in each project.
- Increase in the percentage of organizations where the testing function reports to Project Management rather than to a VP or Director of Quality (in comparison to last years’ report). This could be due to the trend of testing groups becoming part of the organic developments teams, for those implementing Agile or SCRUM.
- Formal training and certification is on the rise. This trend is true mostly for India and Western Europe, but is a trend that reflects the regard for testing as a profession that requires more formal training. While you might not agree that there is such a need for certification and formal training, we can still take it as complement to our professional recognition.
- Communication is still key. With nearly 80% of the responses, the leading “very important” skill a tester needs is good communication skills (3rd year in row by the way). In fact, only 2% of all respondents regarded this as non-important!I have touched on this point before in a previous blog post — Using your Kitchen as a Communication Channel
In a Nutshell…
The accelerating pace of development is making our work more challenging than ever. And overall we are seeing a more serious approach towards quality and testing in our work-ecosystem.
Today, we feel that testing is seen as a critical activity by many of the same people who used to see testers as “unskilled individuals” doing the least important tasks in the end and slowing down delivery.
I mean, we always knew we had an important role in any successful product or application release, but it is becoming apparent that everyone else knows this as well.
DOWNLOAD THE 2016 STATE OF TESTING REPORT >>
The DevOps Zone is brought to you in partnership with HPE. Discover the Top 5 predictions for DevOpsand the central role they will play as enterprises begin to modernize legacy applications.
Topics:
SOFTWARE TESTING
Partner Resources
Portal Partner
Logging in New-Style Daemons With systemd
With new-style daemons, systemd has introduced a new way of writing daemons that vastly simplifies the process for programmers compared to the old approach.
The DevOps Zone is brought to you in partnership with Loggly. Read The Pragmatic Logging Handbookand learn about how the real question is how to log, not how much to log.
With new-style daemons, systemd has introduced a new way of writing daemons that vastly simplifies the process for programmers compared to the old approach. One part of this new approach is the way new-style daemons can handle logging. Instead of worrying about the many complexities involved in logging, such daemons are encouraged to simply use standard output for log messages. systemd handles the rest.
Correct Logging Is Complicated
In the past, programmers implementing logging for their applications were faced with a large number of questions and problems to solve.
If logging is meant to go to a file, the application needs configuration options as to where these files should go, and it must make sure to create any underlying directories with the correct permissions. Such log files need to be rotated and compressed regularly to avoid huge files and wasted space. The application can do this itself, or use external tools like logrotate. When the latter is used, the application needs to provide a way of handling log files being changed while they are open and written to.
Just using syslog is a lot simpler but still poses questions. By default, some logging libraries simply use the UDP port, but that might not be available. Instead, sometimes it is necessary to use
/dev/log instead. In either case, the application has to set up a connection and format all log messages according to the syslog protocol.
With modern centralized logging solutions like Loggly, application developers might even get asked to provide ways of sending logs directly there.
Whichever destination is chosen, though, there is a time between program start and when logging is configured correctly where the daemon cannot actually notify the admin of problems and it is impossible to emit log messages. How would the program notify the admin that it is unable to read the config file that says where to log to, or that it cannot write to the log file, or that there was an error connecting to syslog?
While libraries exist to make most of this a little less painful, this still adds to the complexity of system daemons, their configuration, and their failure modes.
Treat Each Output Line as an Event
There is no need for any of this complexity, though. Modern application designs like The Twelve-Factor App recommend to simply emit log messages as event streams to standard output. Applications do not need to concern themselves with log files, file locations, rotation, syslog ports, or socket locations, and as standard output is available from the very moment the program starts, log messages will never be lost.
The protocol for this log emission is as simple as it could be: Every line is one log message. The process manager is responsible for routing these logs where they should go. systemd, for example, captures output and forwards it to journald and syslog where it can be processed further.
There are two possible gotchas with this approach that applications have to be aware of, though.
First, one event per line means that multi-line messages are not treated as one event. This is not unusual, but especially for backtraces this is important to keep in mind. Newlines in such events still have to be escaped somehow.
Second, this does not allow the application to specify log levels per event emitted. systemd has a small extension to allow this, though. Much like in the syslog protocol, applications can prefix each line with angle brackets and a number to specify the log level:
If the prefix is missing, systemd just uses a configurable default (
INFO, usually), so even this minimal complexity is only necessary if the application needs it.The Remaining Configuration Is Done in systemd
Simply writing to standard output is all the application has to do. Everything else can be configured in the service file of systemd, as documented in systemd.exec(5). Luckily, all of the options have sensible defaults, so usually there is no need to configure anything at all to make use of this feature. And by keeping both the code to do the log handling, as well as the configuration in systemd, all applications can benefit from this and be simplified a lot.
A Daemon Is Now Trivial to Write
Thanks to moving all of the recurring logic of writing daemons into systemd, even a shell script can serve as a daemon. Let’s create the following script as
/usr/local/bin/test-daemon.sh:
This is all there is to our daemon. It will emit its cute message, once per second, cycling through all log level prefixes. To hook this up to systemd, we just need a two-line service file. Create
/etc/systemd/system/test.service with these lines:
That’s it.
systemctl daemon-reload will make systemd find the new service file, and systemctl start test will then start it. You can check that it is running with systemctl status test: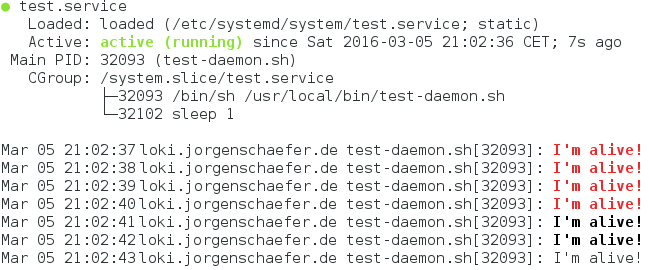
The output goes through systemd to journald, which is why we see it in
status and even get colors to mark messages with higher severities. journald also automatically forwards this to syslog, so we can see our daemon in our log monitoring.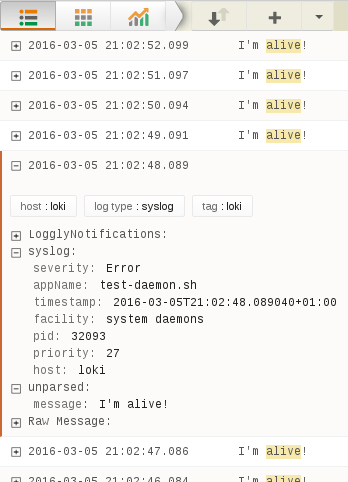
In a sense, we have attached the output of our program directly to Loggly.
Our minimal daemon is already fully integrated with the system without using any special libraries, configuration options, or having to worry about cleaning up log files.
With two more lines in the service file, we can enable this daemon to automatically run at system startup. Another line adds monitoring, so the process will be automatically restarted when it fails.
Application Development Simplified
By using this approach, daemons can be extremely simplified, both in regards to code complexity as well as the required configuration options. Thanks to systemd’s configuration options, all features of syslog, like the facility or application name, can still be used when required. And because all log messages go through the same channels, they can be easily filtered and routed.
The DevOps Zone is brought to you in partnership with Loggly. Learn a number of useful benchmarking techniques by going hands-on with Elasticsearch.
Topics:
SECURITY,LOGGLY,DOCKER,LOGGING,ATTACK
Platinum Partner
Rackspace Becomes AWS DevOps Competency Partner
Helping AWS Customers Launch and Manage Apps More Efficiently
The DevOps Zone is brought to you in partnership with New Relic. Download 5 Unsung Tools of DevOpsto see which tools make the cut and why.
Rackspace® (NYSE: RAX) has achieved Amazon Web Services™ (AWS) DevOps Competency within the AWS Partner Competency Program, which recognizes members of the AWS Partner Network who have completed a rigorous third-party audit demonstrating their expertise in DevOps practices, tools, and proven customer success. Customers can access this expertise and 24x7 operational support through Fanatical Support® for AWS architects and engineers, who collectively hold over 270 AWS Professional and Associate certifications across the globe.
Historically, the process of deploying and managing applications has been manually intensive and customized. Manual deployment and management of applications generally leads to outcomes such as fewer release cycles, longer lead times, and unpredictable quality, all of which impact time to market and stable operations. Applying those manual and custom practices in a cloud environment negates the inherent advantage of software defined infrastructure. DevOps is the use of practices, tools and automation that can improve the efficiency of how businesses run applications in the cloud.
Fanatical Support for AWS provides businesses access to certified AWS experts who can help implement and operate workloads on AWS using DevOps practices and tooling, both from AWS and leading 3rd parties. Rackspace DevOps expertise can help customers improve the speed, frequency, and quality of their software deployments and the accompanying operational processes. Customers using the Aviator™ service receive ongoing support for native AWS DevOps tools such as AWS OpsWorks, AWS CloudFormation, AWS CodeDeploy, AWS CodePipeline and AWS CodeCommit. As an additional service, Rackspace engineers can utilize a broad range of leading third-party DevOps tools, such as Chef™, SaltStack, and Ansible to help ensure that customers have choice around their preferred DevOps toolset.
“Rackspace has been active in DevOps practices since 2012, working to help customers increase speed and consistency in their operations. We are excited to be recognized by AWS and to apply our knowledge to customers working on the AWS platform,” said Chris Cochran, senior vice president and general manager of AWS at Rackspace. “Not all customers start with a high degree of expertise in this area, but Rackspace can help these businesses continually improve their efficiency with running apps in the cloud.”
The DevOps Zone is brought to you in partnership with New Relic. Read about where DevOps startedand how the adoption rate went from tiny startups to giant Fortune 500 enterprises.
Topics:
DEVOPS,AWS,RACKSPACE
How Otto Puts Docker's Development and Deployment Capabilities to Shame
Otto is the successor to both Vagrant (also by developer HashiCorp) and Docker; Otto builds infrastructure from the app up.
The DevOps Zone is brought to you in partnership with HPE. Learn about the seven KPI’s that create the foundation of DevOps metrics and how it continues to evolve as the DevOps Methodology becomes more engrained in enterprises.
Docker Who? That time-travelling Vagrant? Why is it so hard for DevOps to get the tools they need to quickly build scalable infrastructure that doesn't cause a provisioning headache?
Thanks to a new concept of development and deployment created by HashiCorp, you can get the benefits of emerging approaches Otto-matically. 
Otto is for Automated Development Environments
Both Docker and Vagrant have specific limitations; Docker is a single concept but a lot of tools and processes that are separate, Vagrant is ideal for building a virtual machine, but isn't, in and of itself, directed toward app development.
Otto is much simpler, runs in *nix, OSX, and Windows, and installs in seconds. Otto also supports key features like SSH and deployment to AWS.
A Simplified Build Procedure
Otto needs a minimal set of instructions to work because it's purpose built to create microservices and was created, in large part, as a response to the burden of specialized knowledge that shouldn't concern devs who just want to code, not necessarily delve deep into infrastructure.
appfile specifies and generates:- Development environments,
- Build systems,
- Infrastructure, and
- Deployment.
 otto dev
- A virtual machine, and
- Upstream dependencies.
otto infra- Provisions servers
otto build- Packages the app for deployment

otto deploy- Takes the app from appfile, references the provisioning created by otto infra, and builds artifacts from otto build.
Resources
- Otto Documentation
- Otto Tutorial and Example Ruby App
Image Credits: Ottoproject.io
The DevOps Zone is brought to you in partnership with HPE. Discover the Top 5 predictions for DevOpsand the central role they will play as enterprises begin to modernize legacy applications.
Topics:
INFRASTRUCTURE DESIGN,NETWORK ARCHITECTURE,DEVELOPMENT TOOLS
Portal Partner
Study Reveals How Devops Grows Revenue
We've all known that DevOps makes things easier but now there are hard numbers that suggest that DevOps can directly lead to revenue and profit growth.
The DevOps Zone is brought to you in partnership with DBmaestro. Learn more about what Continuous Delivery for the Database actually is and overcome mistrust issues.
Enterprise Management Associates (EMA) has recently published new research into release automation and its impact on Continuous Delivery. One of the subjects it explored was how DevOps grows revenue.
The study indicated a direct correlation between the quality of Dev/Ops interactions and revenue growth. Respondents were first asked how much their company’s revenue had grown in the previous 12 months, then asked about the quality of interactions between Dev and Ops. Some 92% of organizations that reported those interactions to be ‘excellent’ or ‘above average’ experienced revenue increases of 10% or more. Meanwhile, the 8% of companies that reported Dev/Ops interactions to be ‘average’ or ‘poor’ had revenue increases of less than 10%, or they were flat/decreased.
The bottom line? Companies that excel at DevOps interactions are 11 times more likely to see double-digit annual revenue growth. It doesn’t stop at revenue growth either. According to EMA, 49% of organizations also agree that accelerated delivery frequency leads to higher customer satisfaction. And 35% find it enables them to be more agile and competitive.
The EMA study also found that the biggest ‘bottleneck’ slowing down the Continuous Delivery pipeline is manual troubleshooting processes to deal with problems arising from production changes (44% of organizations agree). This indicates that errors continue to slip through accelerated delivery processes into production. Automation mitigates the need for manual intervention—ensuring errors don’t make it into production. Audit trails also make it easier to track down any lingering production issues.
Organizations are waking up to the value of automation. Asked which area they would most likely invest in within the next 12 months, 35% would invest in ‘deployment/release automation supporting continuous delivery’. This makes sense: automation can help ensure Continuous Delivery processes are reliable and safe, time after time. It enables organizations to control what is deployed where, by whom and when. And it cuts the lead time needed to push changes into production.
Often overlooked is the database which can threaten the integrity of software development processes. It holds essential business information which require special attention. For example, database changes must be synchronized with code changes to proactively prevent conflicts that may impact production. Furthermore, the database must have its own automated deployment and release method, as well as testing tools and continuous delivery procedures. Check out this popular eBook to get you on the path of continues delivery for your database developments.
The DevOps Zone is brought to you in partnership with DBmaestro. Learn more about what Continuous Delivery for the Database actually is and overcome mistrust issues.
Topics:
DEVOPS,SECURITY,DATABASE,DBA,MICROSOFT,AGILE ADOPTION,RELEASE MANAGEMENT,CULTURE,LINUX,SQL SERVER
Platinum Partner
Come Speak at DevOps Enterprise Summit 2016!
Call for submissions for the now-annual conference from Electric Cloud and IT Revolution.
The DevOps Zone is brought to you in partnership with New Relic. Download 5 Unsung Tools of DevOpsto see which tools make the cut and why.
We are excited to be joining forces with IT Revolution again for the 3rd year of the DevOps Enterprise Summit 2016, taking place November 7th-9th in San Francisco, CA.
We invite you to attend the event (Early bird pricing ends May 16) to learn from your peers and also share your own experiences by joining us as a speaker!
The Theme for #DOES16 San Francisco Conference is Leading Change
We want to hear stories from the leaders of large, complex organizations implementing DevOps principles and practices.
This year’s programming will be based on series of survey questions about the biggest issues IT professionals continue to work with. Several universal topics emerged, and we will be selecting talks that address them:
People and Culture: We’re interested in the strategies and methods you employed to successfully lead change and to enable DevOps outcomes in large organizations. How did your approach to leadership and organizational design differ from those used in more traditional IT organizations? How is the workforce different, both for employees as well as contractors and outsourcers? And what have been your results?
Process and Technology: We are interested in the practices you have adopted to integrate change into your workforce and build on changing relationships with your vendors. What are modern architectural and technical practices that every technology leader needs to know about?
Compliance and Security: We’re interested in concrete ways you have helped DevOps bridge the information security and compliance gap, showing auditors and regulators that effective controls exist to prevent, detect, and correct problems.
Feel Like You Have a Good Story to Tell?
We want to hear from you! Submit your proposal for a chance to be among your peers talking about the realities and future of software development. But don’t wait, the submission deadline is May 2, 2016.
Submit your proposal now »
Early Bird Tickets Now Available!
Don’t feel like speaking? No problem. Early Bird Tickets to the conference are available until May 16th. Guarantee your spot and save over $300 off the full price ticket.
Get your ticket now »
The DevOps Zone is brought to you in partnership with New Relic. Read about where DevOps startedand how the adoption rate went from tiny startups to giant Fortune 500 enterprises.